The key performance indicators found in the reports from your SEO consultant should be assessed for how visitors are responding to your site.
The information your site generates can be used to determine whether you’re on track in achieving specific campaign goals as well as indicate its strengths and weaknesses in achieving specific goals.
Google Analytics is a commonly used tool to track the performance data of your website. An analytics report will indicate where your website is falling short and how you can improve in those areas.
Table of Contents
ToggleSources of traffic
The traffic your site generates comes from multiple channels, which are separated, into paid, organic, social media and referral traffic. When assessing the traffic your site is receiving it’s important to understand how each channel performs individually to evaluate the effectiveness of each source.
Monthly search volume
When you’re engaged in SEO you should be aware of the traffic your site is generating. Are you getting the monthly traffic from the right channels? Is your monthly search volume declining or rising each month? Is this in line with the expected results of your SEO campaign?
Keep in mind that if your campaign targets low volume keywords that convert higher than it would be expected to have a lower search volume. In this case, the volume isn’t a KPI in your campaign, and you would want to see improvement from your engagement statistics.
Average time spent on page
The time a user spends on your page can be a good indication of their level of interest. If the overall time of your average user is increasing, this is a sign your visitors are spending more time engaging with your content.
The longer you can keep a visitor on your site, the more likely you are to convert them to a client. This is why the average time spent on a page, or dwell time is statistic your SEO consultant will try to improve.
Average pages viewed per session
A higher value indicates that your visitors like what they are finding on your site. If they are exploring page after page, your content is obviously on track in providing user intent.
When there are fewer pages viewed per session this could mean your internal linking strategy and navigation needs improvement. Connect your pages with links to related content to see an improvement in this metric.
Make your content accessible and easy to find starting on your homepage. If your visitor has topic options to choose from they are more likely to explore more pages on your site.
Conversions
Conversions are the goals you set up that you want visitors to accomplish on your website. The conversions you set up in Analytics can be anything from calling your business, filling out a contact form, subscribing to a newsletter, downloading upgraded content or making a purchase.
Your conversion rates give you insight into the flow of your content and how you funnel your visitors. Are you gently urging users towards your goals? Are you using an effective call to action for completing those conversions?
You can see where your users are exiting your website to make changes to pages that are not effective in guiding or converting your visitors to achieve your on-site goals.
New users vs. returning visitors
This is a useful metric to know whether your campaign efforts are reaching new users and driving traffic that will help to grow your business. Growth through new clients and more sales is the end goal, which means your site; needs to be attracting new users in order to contribute to the bottom line.
Bounce rate
When a user lands on your site and backs out, this increases your bounce rate. Analytics will measure the bounce rate based on whether a user clicks on any other pages on your site.
Although this indicator can show how well your site is being matched with your traffic, it won’t indicate whether you are providing exactly what the user needs-making there no reason for them to click further.
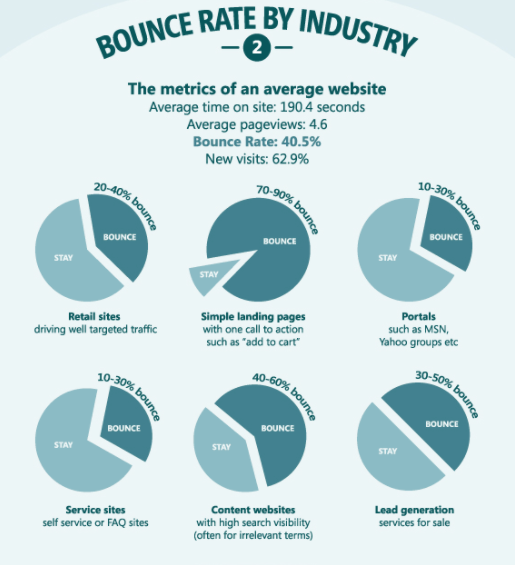
The lower your bounce rate, the better indication of higher levels of engagement. Keep your bounce rate under 50% and you’re in the average bracket for most websites. Here is an infographic from Crazy Egg showing the average bounce rate by industry.

Search Console
The statistics in your search console will vary from your Analytics account. Here you can find stats and information that can provide you with more insight on how your website is performing.
Impressions vs. clicks
It’s important to know how many times your website is being displayed for specific queries. In the search console, you can see what keywords your site is being displayed for as well as how many clicks it’s receiving.
Understand your key performance indicators
In order to know how your website is progressing, you need an awareness of what it is doing now. Get familiar with the key performance indicators that apply to your campaign goals. Take the next step to increase the size of your business with our SEO services.


